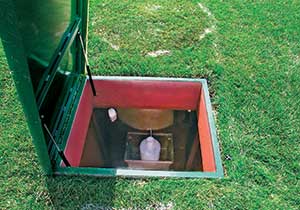
The bottom portion of the stainless steel lysimeter and the carboy that collects leachate can be seen inside the access chamber. (Photo: Kevin Frank, Ph.D.)
Turfgrass systems require a diversity of inputs to achieve a functional, high-quality surface. Among inputs that influence performance and quality, fertilizer applications are some of the most critical.
Although fertilization is essential, fertilization practices continue to be scrutinized for the amount applied and the potential for contaminating ground and surface water. In addition to phosphorus fertilizer regulations, several states now regulate nitrogen applications on turfgrass. Since the late 1980s, environmental concerns have prompted numerous studies on nitrogen leaching from turfgrass.
The United States Environmental Protection Agency has set the maximum contaminant level (MCL) for nitrate-nitrogen (NO3-N) in drinking water at 10 ppm. Drinking water in excess of the nitrate MCL may cause detrimental health effects, including blue-baby syndrome (methemoglobinemia).
There has been extensive research on the fate of nitrogen applied to turfgrass, and the issue of NO3-N leaching in particular. In most cases, research on NO3-N leaching in turfgrass indicates that leaching poses little risk to the environment. However, the majority of leaching research has been conducted on relatively young turf stands, and the age of a turf stand has been proposed as an important factor influencing N fate.
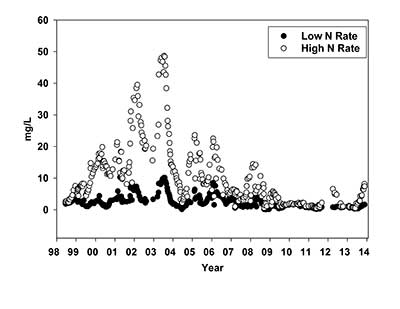
Nitrate (NO3-) N concentration in leachate collected from 1998 to 2014 from Kentucky bluegrass turf fertilized at a low and high N rates. One ppm is equal to 1 mg/L. (Data provided by Kevin Frank, Ph.D.)
Determining N fate
Research at Michigan State University to determine nitrogen fate and leaching from Kentucky bluegrass turf was initiated in 1989 by Bruce Branham, Ph.D., now at the University of Illinois, and his graduate student at the time, Eric Miltner, now a Ph.D. at Koch Industries.
Four intact monolith lysimeters were constructed between the fall of 1989 and summer of 1991. The cylindrical lysimeters were constructed of 0.2-inch thick grade 304 stainless steel. The lysimeters are 3.75 ft. in diameter and 4 ft. deep. The bottom of the lysimeters have a 3 percent slope to facilitate leachate draining to a tube on one side. The soil type is a Marlette fine sandy loam (62 percent sand, 22 percent silt, 16 percent clay). Kentucky bluegrass (Poa pratensis L.) was established on top of the lysimeters (Figure 1).

Mean nitrate-nitrogen concentration in leachate for low and high N rate treatments. † Low N rate = 2.0 lbs. N/1000 sq. ft. per year. ‡ High N rate = 5.0 lbs. N/1000 sq. ft. per year from 1998 through 2002; 4.0 lbs. N/1000 sq. ft. per year from 2003 through 2013. (Data provided by Kevin Frank, Ph.D.)
The research initiated in 1991 evaluated an annual N rate of 4 lb./1,000 sq. ft., with emphasis on either spring or fall applications. Leachate samples collected from 1991 through 1993 indicated that there was minimal risk of NO3-N leaching from turfgrass. NO3-N concentrations in leachate generally were below 1 ppm throughout the research. From 1994 through the spring of 1998, the lysimeter area at MSU was fertilized with 3 lbs. N/1,000 sq. ft., but there were no samples taken from the lysimeters for nitrogen analysis. Jim Baird, Ph.D., now at the University of California Riverside, reinitiated leaching research in the summer of 1998. Water samples have been collected from the same monolith lysimeters and analyzed for NO3-N since July of 1998. The turfgrass area has now been under continual fertilization practices for 28 years with leachate collection for the last 20 years consecutively. To our knowledge, the long-term nitrogen leaching research at MSU is the longest-running turfgrass nitrogen leaching research in the world.
Dramatic and modest increases
From July 1998 through 2002, lysimeters were treated annually with urea at a low N rate of 2 lbs. N/1,000 sq. ft. (0.5 lb. N/1,000 sq. ft./application) and a high N rate of 5 lbs. N/1,000 sq. ft. (1 lb. N/1,000 sq. ft./application). From 1998-2002, the high N rate saw a dramatic increase in NO3-N leaching from 5 ppm in 1998 to 25 ppm in 2002 (Figure 2). One ppm is equal to 1 mg/L. During the same time frame there was a modest increase in NO3-N leaching for the low N rate from 3 ppm in 1998 to 5 ppm in 2002.
Because of the high nitrogen concentrations in leachate from the high-N rate lysimeters, the decision was made in 2003 to reduce the annual N rate to 4 lbs. N/1,000 sq. ft. The low N rate remained the same, 2 lbs. N/1,000 sq. ft. In 2003, the concentration of NO3-N leaching from the high N rate treatment did not decline from the previous years. The average NO3-N concentration leached from the high N rate treatment in 2003 was 32 ppm. In 2004, the concentration of NO3-N leaching from the high N rate treatment declined drastically from 32 ppm in 2003 to 9 ppm in 2004. Over the next 14 years, the NO3-N concentration in leachate from the high N rate decreased dramatically to the point that the concentrations in leachate in 2017 were similar to what was initially measured for both N rates (3 ppm at the low N rate and 5 ppm at the high N rate) when the research was initiated in 1998 (Table 1).
Graphic: Golfdom staff
Twenty years of data
Throughout the 20 years of collecting leachate, there were peaks and valleys in NO3-N concentration in leachate, especially for the high N rate. Peaks in NO3-N leaching were especially evident centered around Jan. 1 in 2002, 2004, 2005, 2006 and 2008 (Figure 2). We analyzed these data to determine if there were differences between NO3-N leaching in the growing and dormant seasons. Although there were individual leaching events during the dormant period with high concentrations of NO3-N, especially for the high N rate, the means during the dormant and growing season were not significantly different in most years.
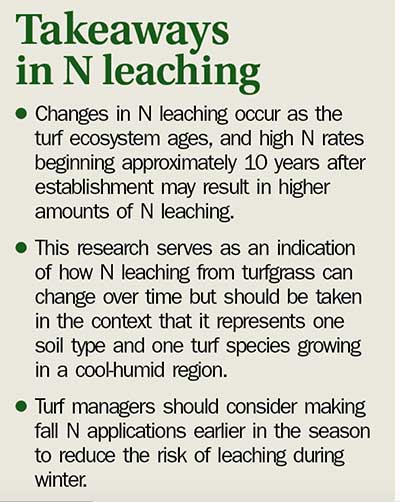
However, during the dormant season, when the turf is not using nitrogen (and in climates such as Michigan when soils may remain unfrozen for a portion of the dormant season) NO3-N leaching may occur and individual leaching events may have higher NO3-N concentrations than during the growing season. The practical significance of this finding: Turf managers should consider making fall N applications earlier in the season to reduce the risk of overwinter leaching.
Leaching and non-leaching rates
Several researchers have suggested that the ability of soil to store organic N under relatively constant management and climatic conditions (typical of turf systems) would decrease with time, and that an equilibrium level of soil organic N eventually would be obtained. A 1980 examination was made of total N content in soil to a depth of 16 inches in 105 turf systems ranging in age from 1 to 125 years old on Long Island, N.Y. The data suggest that soil organic matter accumulation is rapid in the first 10 years after establishment and slowly builds to an equilibrium at 25 years, when no further net N immobilization occurs.
The 1980 results indicated that there is a rather limited capacity of the soil to store organic N, and that after 10 years the potential for over-fertilization is greatly increased. Research in 1990 proposed that older turf sites (greater than 25 years of age) lose the ability to store additional N in the soil, and therefore should be fertilized at a rate equal to the rate turf uses N.
Our research at MSU supports the general hypothesis that the ability of a soil to store soil organic N changes as the site ages. What’s surprised us is that the 5 lbs.-N rate resulted in significant NO3-N leaching, while the 4 lbs.-N rate has not.
We are not stopping after passing the 20-year milestone this July. We decided this year to increase the high N rate to 5 lbs. N/1,000 sq. ft. once again to determine if, in the 15 years since the high N rate was reduced, it will once again result in high NO3-N leaching concentrations. We will continue to monitor nitrogen leaching in a continually fertilized turfgrass system and provide insight into the effect of N rates on leaching as the turfgrass ages.
Funding for this research was provided by the Michigan Turfgrass Foundation and the United States Golf Association.
References
Frank, K.W., K. O’Reilly, J.R. Crum, and R.N. Calhoun. 2006. The fate of nitrogen applied to a mature Kentucky bluegrass turf. Crop Sci. 46:209-215.
Frank, K.W., J.R. Crum, J.M. Bryan, and A.D. Hathaway. 2016. Fifteen years of nitrogen leaching from a Kentucky bluegrass turf. Crop Sci. 56:1-7. doi: 10.2135/cropsci2016.03.0197
Miltner, E.D., B.E. Branham, E.A. Paul, and P.E. Rieke. 1996. Leaching and mass balance of 15N-labeled urea applied to a Kentucky bluegrass turf. Crop Sci. 36:1427-1433.
Petrovic, A.M. 1990. The fate of nitrogenous fertilizers applied to turfgrass. J. Environ. Qual. 19:1-14.
Porter, K.S., D.R. Bouldin, S. Pacenka, R.S. Kossack, C.A. Shoemaker, and A.A. Pucci, Jr. 1980. Studies to assess the fate of nitrogen applied to turf: Part I. Research project technical complete report. OWRT Project A-086-NY. Cornell Univ., Ithaca, NY.


